Effective policies to fight Covid-19 require policymakers abide by the advice offered by qualified scientists using valid scientific data. Georgia Governor Brian Kemp, for example, put Georgians at risk by ignoring experts advising that the virus could spread by those infected but not showing symptoms of Covid-191. The price for Governor Kemp’s ignorance was paid by innocent Georgians.
Scientists worldwide are working intensively and extensively to collect the scientific data and evidence to inform policymakers (at least those willing to listen) drafting policies to mitigate the damage from SARS-CoV-2, the virus responsible for Covid-19. Among the crucial questions:
- Can people infected but not showing symptoms shed viable virus to infect others?
This was the question Governor Kemp failed on. Unlike most other questions, the answer to this one is a fairly straightforward ‘Yes’ or ‘No’. And the correct answer, Yes, was evident early on.
- What is the lag period between infection and appearance of usual symptoms (fever, cough, breathing difficulties)?
The lag period sets the range for establishing mitigation strategies. If we don’t know this duration, we can’t calculate appropriate quarantine or self isolation periods after contact with a known carrier. If we calculate too short, and release an asymptomatic patient too early, he or she can go out to unknowingly inoculate others. Similarly, if we relax controls too soon, asymptomatic people can inadvertently initiate a resurgence, or “second wave” of the contagion. Knowing that it takes only one infected patient released too early to start a new wave makes the answer to this question crucial to controlling the plague. How many waves or resurgences are we as a society willing to tolerate?
- How many others, on average, will an infected person infect?
This is the famous “R0” (“R-nought’) question, used to estimate how contagious the pathogen is. If the value is high, it means rapid spread and distribution. Seasonal influenza has an R0 of 2 to 3, meaning a person with the 'flu will pass it on to two or three others, on average. Measles is over 12. The estimate for SARS-CoV-2 is about 5.7, so a Covid-19 victim will infect, on average, five or six other people, each of which will also go on to infect five or six others.
- How far can viral particles travel from an infected person to successfully infect another person?
Scientific analysis is needed to calculate this distance to inform effective social distancing. The current recommendation, based on estimates, in the USA is six feet, in Europe and elsewhere it is a bit larger, two meters. Is this distance sufficient to minimize contagion? Or is it unnecessarily distant? More data are required to gain confidence in the recommendation.
Getting reliable answers to these latter questions has been difficult for several reasons, not least of which is the rapid spread of the plague, overwhelming epidemiologists (specialty scientists who study the onset and spread of contagions) as well as physicians, nurses and other medical professionals dealing with a sudden tsunami of sick people. Trying to identify “Patient Zero”-- the first victim -- in a given location has been complicated by the sheer numbers of patients, their various prior and subsequent contacts, and the uncertainty of the lag period between infection and appearance of symptoms.
Now, a new study2 (although not fully peer reviewed) sheds some light and data to help answer these questions. Dr Lu et al. tracked down the "Patient Zero" in an initial outbreak to a family having lunch at a restaurant in Guangzhou, China.
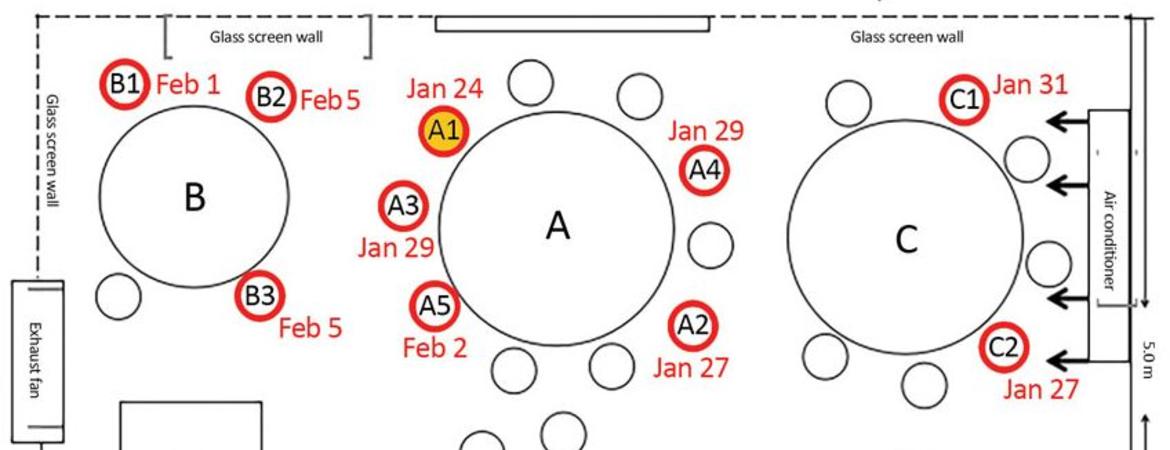
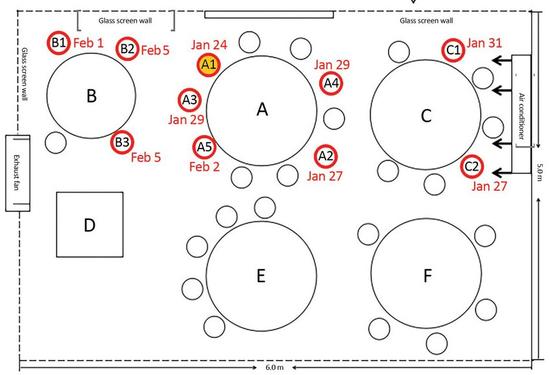
Briefly, on January 23 a family showing no symptoms departed Wuhan (the origin of the pandemic) just before a lockdown closed that city, and traveled to Guangzhou, a city previously devoid of Covid-19. Five apparently healthy members of the family went to lunch at a local restaurant next day and sat at a round table (Table “A”) between two other tables set about three feet apart (see Figure). On the left, a family of three occupied Table B, spending 53 minutes adjacent to the family from Wuhan at Table A. On the right, a family occupying Table C stayed for 73 minutes adjacent to the Wuhan family’s table. Later that same day, January 24, one of the diners from Wuhan sitting at Table A ("Patient Zero", A1) started coughing and developed a fever. Subsequently, nine others lunching at Tables A, B and C also contracted Covid-19. The five victims at Tables B and C had no other opportunity to contract the virus other than via the Wuhan family they shared the lunch restaurant with on January 24, providing a scientifically solid “anchor” for the time and place of inoculation. It also confirmed that an asymptomatic carrier can indeed infect others.
The time and place anchor provides a basis for calculating the lag period between infection and onset of symptoms. The five showed symptoms beginning January 27, 31 (Table C), and (Table B) February 1, 5 and 5 (although it’s possible these latter two were later infected by their Tablemate who showed symptoms February 1st). Thus, the lag period was 3 days, 6 days, 7 days and (possibly) 11 days. These data support the current policy foundations of 2 to 14 days for onset of symptoms as a reasonable quarantine period after possible infection.
Less reliable is the R0 calculation, as we don’t know how many others were infected by the initial case. But it was at least three (and possibly five) victims from Tables B and C at that one lunchtime encounter alone. In addition, four others at Table A later contracted Covid-19, but we cannot be sure when or from whom they were inoculated, so they cannot be included in the R0 calculation.
The fourth question, travel distance of viral inoculum, is confounded here because an air conditioner over Table C constantly blew air over all of the tables and so mixed the air. Nevertheless, all victims of the lunchtime distribution were sitting at the same or adjacent table as the initial victim. Of the 83 others in the restaurant that lunchtime, no other diners or workers, including those at nearby but not adjacent tables, contracted Covid-19. Clearly, some victims, particularly those at Table C, were further than six feet away-- possibly as much as 12 feet, although exact measurements were not recorded.
Questions arise from this study. How did Patient A1 infect the others if she wasn’t coughing? If the pathogen was solely in her breath, how did her virulent breath infect those at Table C when the air conditioner was blowing air away from Table C? What were the differences in severity of the disease among these victims? How long were they ill? Are they all recovered now?
This small study helps us understand the dynamics of SARS-CoV-19 spread and Covid-19 onset. As data from additional such studies accumulate, scientists will continue to refine, modify and re-set recommendations for public policy with increasing confidence.
But in the meantime, considering the fact that asymptomatic carriers can infect others, the long lag time of up to 14 days between infection and appearance of symptoms, and the high R0, it remains irresponsible for policymakers to relax social distancing rules until at least 14 days have passed since the last case resolves. No matter what the ‘official’ policy may be, I will maintain rigorous social distancing and stay at home for a full 14 days after the last confirmed case in my community. All it takes is one asymptomatic carrier to rekindle a second wave insurgence of Covid-19 and we're all back to square one.

Citations and Links
2. Lu J, Gu J, Li K, Xu C, Su W, Lai Z, et al. COVID-19 outbreak associated with air conditioning in restaurant, Guangzhou, China, 2020. Emerg Infect Dis. 2020 Jul [date cited]. https://doi.org/10.3201/eid2607.200764
See also:
Chang, K. New York Times, April 20, 2020. https://www.nytimes.com/2020/04/20/health/airflow-coronavirus-restaurants.html